Network diagnosis with pingplotter
Pingplotter is a Windows program, similar to the traceroute command, that shows the path between a client and a server, but that does so in a much clearer fashion. A freeware version can be downloaded from
http://www.pingplotter.com
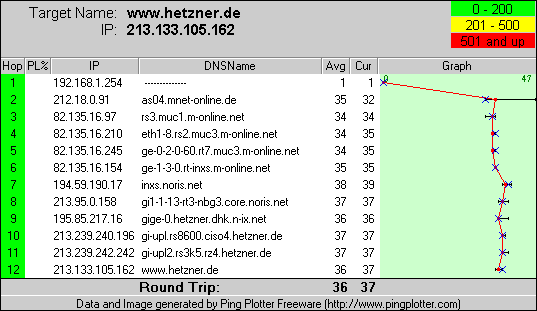
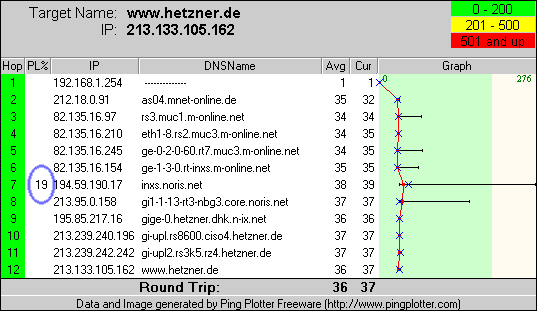
This picture shows an almost perfect path from the client to the server. The second column lists the packet loss, so the test packets that got lost. Since this example didn't have any packet loss this column is empty.
In the columns IP and DNSName the path that the test packets take can be traced. The path starts with the Munich provider M-Net, at hop 6 and 7 (at the peering node INXS) given to Noris and then finally in hop 9 (at the peering node NIX) given to the Hetzner network.
The columns Avg and Cur show the amount of time it takes a packet (in ms) to get to the hop: Avg is the average time, Cur shows the value of the last test packet.
At the end the the timing of the packet transmissions is shown graphically. "Outliers" can be quickly identified by the course of the red line. However, you can only draw limited conclusions from the position of the line: the black lines show the different between the fastest and slowest reply for the particular hop. If a hop responds particularly slowly however, then the red line moves to the left (since more space is needed to the right).
mtr
If you don't have Pingplotter then you can get the same basic functionality with the program mtr (WinMTR for Windows). How mtr works is described here.
Typical errors
It's "lagging"!
Ping times increase, terminal sessions become jerky and games become unplayable. The server is not always the culprit, though using pings as a diagnostic tool is not very helpful:
Pingplotter offers much better information:
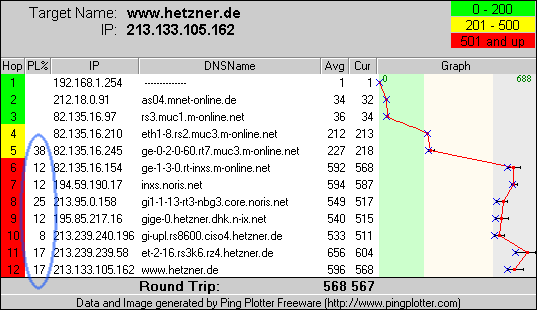
One can immediately see that the error (in this simulation) is in the network of M-Netz. Starting with hop 4 there are significant delays, packets from hop 5 are partially discarded (which can in turn be contributed to an error in hop 4) and hop 6 introduces excessive delays. Fault patterns such as this can be caused by severe shortages, such as those incurred by DDoS attacks.
Packet loss
In this example the case is different: while there are many discarded packets starting at hop 10, the ping times of 37ms are in the normal range. This could be caused by a defective router or a faulty cable.
Everything is slow
Especially with DSL connections the following error screen is often seen:
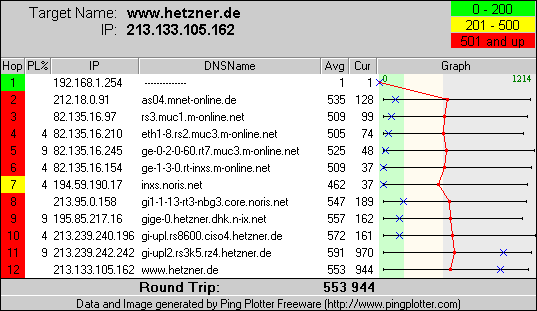
This traceroute does not really show the problem. Pingplotter is again more helpful:
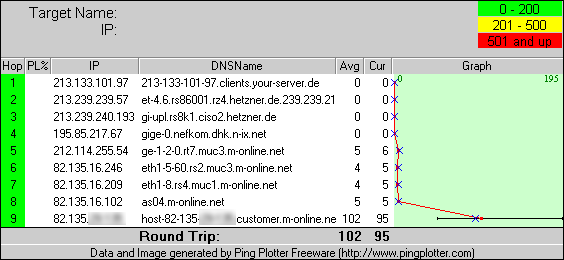
A high load as early as the second hop points to an overload of the private internet connection, which can be caused for example by sending large amounts of data via email, clogging up the upstream ADSL connection. File-sharing tools that suck up bandwidth in the background and have long since been forgotten could also be a problem. A clear picture of the problem can be found by performing a trace in the opposite direction:
Everything looks find (green), up until the router of the client answering too late. Conceivable problems would be either a disruption of the internet connection or an overloading of the router.
Packet losses, which aren't real
This is not actually a problem/mistake, since not answering test packets is normal for routers. Depending on the configuration of the router it will route packets but only reply to test packets if there is enough free computing power. As long as the following hops don't also show packet loss there is no cause for concern.
Asymmetrical routing
A fault diagnosis is relatively easy if the round trip between the client and the server follows the same path. However, often packets will take a different return route (this is caused by different requirements of the provider of the client and the server location).
The following animation (Flash plug-in required) illustrates the problem:
Error example
In the following example the Hetzner network seems to be the cause of the delays. Starting with the first Hetzner router ping times are significantly increased and packets are discarded:
Client ---> Server
| 1 | 67 ms | 65 ms | 66 ms | 62.26.xx.xx |
| 2 | 63 ms | 63 ms | 65 ms | 62.26.251.97 |
| 3 | 80 ms | 74 ms | 76 ms | so-6-0-0.core3.f.tiscali.de (62.27.95.2) |
| 4 | 74 ms | 75 ms | 73 ms | so-3-0-0.fra30.ip.tiscali.net (213.200.64.25) |
| 5 | 73 ms | 74 ms | 75 ms | ffm-s2-rou-1071.DE.eurorings.net (80.81.192.22) |
| 6 | 75 ms | 74 ms | 75 ms | ffm-s1-rou-1001.DE.eurorings.net (134.222.227.65) |
| 7 | 78 ms | 79 ms | 78 ms | nbg-s1-rou-1071.DE.eurorings.net (134.222.227.30) |
| 8 | 84 ms | 78 ms | 79 ms | gi-0-1-286-nbg5.noris.net (134.222.107.26) |
| 9 | 392 ms | 393 ms | * | ne.gi-2-1.RS8000.RZ2.hetzner.de (213.133.96.65) |
| 10 | 393 ms | * | 392 ms | et-2-16.RS3000.RZ2.hetzner.de (213.133.96.38) |
| 11 | 393 ms | 392 ms | * | (...) |
Only when a trace route in the opposite direction is made is the real source of the error recognized:
Server ---> Client
| 1 | 213.133.xx.xx (213.133.xx.xx) | 0.233 ms | 0.205 ms | 0.281 ms |
| 2 | et-1-11.RS8000.RZ2.hetzner.de (213.133.96.37) | 0.653 ms | 0.660 ms | 0.650 ms |
| 3 | nefkom-gw.hetzner.de (213.133.96.66) | 1.119 ms | 0.423 ms | 0.415 ms |
| 4 | GW-SF-BBR-06-S2-3.nefkom.de (212.114.147.23) | 0.635 ms | 0.807 ms | 0.457 ms |
| 5 | hsa2.mun1.pos6-0.eu.level3.net (212.162.44.25) | 6.811 ms | 6.347 ms | 6.143 ms |
| 6 | ae0-19.mp1.Munich1.Level3.net (195.122.176.193) | 315.587 ms | 314.949 ms | 315.164 ms |
| 7 | so-0-0-0.mp1.Frankfurt1.Level3.net (212.187.128.90) | 301.324 ms | 300.789 ms | 300.742 ms |
| 8 | gige1-2.core1.Frankfurt1.Level3.net (195.122.136.101) | 301.673 ms | 300.853 ms | 301.087 ms |
| 9 | de-cix.fra30.ip.tiscali.net (80.81.192.30) | - | 317.844 ms | 317.634 ms |
| 10 | so-4-0-0.core3f.tiscali.de (213.200.64.26) | 318.453 ms | - | 318.021 ms |
| 11 | so-1-0-0.core1.hh.tiscali.de (62.27.95.38) | 307.780 ms | 307.230 ms | 307.252 ms |
| 12 | ge-2-0-0.7.core0.hh.tiscali.de (62.27.93.83) | 307.431 ms | 307.298 ms | 307.084 ms |
| 13 | 62.26.251.101 (62.26.251.101) | - | 307.753 ms | 308.933 ms |
| 14 | (...) | 390.856 ms | 399.355 ms | - |
In this case there was an error between two Level3 routers in Munich. The problem seemed to be with Hetzner since the packages up to hope 8 (noris) were successfully routed back. Test packets to the Hetzner network and back however took a different route back, resulting in the delay in Munich.

